The figure given below shows the demand curves for five products: A,B,C,D,andE. Figure 5.1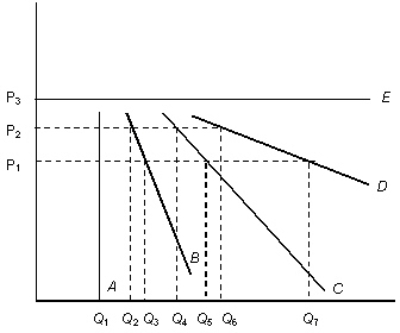
- Refer to Figure 5.1.The value of the coefficient of price elasticity of demand for E is:
A) more elastic compared to demand curve E.
B) less elastic compared to demand curve C.
C) perfectly elastic.
D) more elastic compared to demand curve D.
E) an example of a unit-elastic demand curve.
Correct Answer:
Verified
Q15: What would be the consequences of a
Q16: If a 1 percent change in the
Q17: If a 50 percent increase in the
Q18: The figure given below shows the demand
Q19: Assume that the price elasticity of demand
Q21: Consider a medical breakthrough that led to
Q22: The figure given below shows the demand
Q24: An economic survey observed that,a 20 percent
Q25: If a price increase from $20 to
Q36: The figure given below shows the demand
Unlock this Answer For Free Now!
View this answer and more for free by performing one of the following actions

Scan the QR code to install the App and get 2 free unlocks

Unlock quizzes for free by uploading documents