The figure given below shows the demand curves for five products: A,B,C,D,andE. Figure 5.1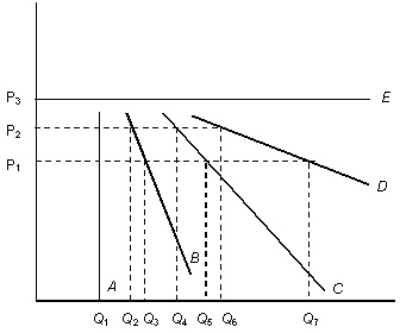
- Refer to Figure 5.1.The demand curve E is most likely to represent the demand for:
A) alcohol by an alcoholic.
B) a life-saving drug.
C) holiday travel packages.
D) a particular brand of breakfast cereal.
E) air conditioning during a hot summer.
Correct Answer:
Verified
Q13: Suppose 50 loaves of bread are demanded
Q14: The figure given below shows the demand
Q15: What would be the consequences of a
Q16: If a 1 percent change in the
Q17: If a 50 percent increase in the
Q19: Assume that the price elasticity of demand
Q20: The figure given below shows the demand
Q21: Consider a medical breakthrough that led to
Q22: The figure given below shows the demand
Q36: The figure given below shows the demand
Unlock this Answer For Free Now!
View this answer and more for free by performing one of the following actions

Scan the QR code to install the App and get 2 free unlocks

Unlock quizzes for free by uploading documents