Figure 2-17
Relationship Between Years of Education and Annual Income
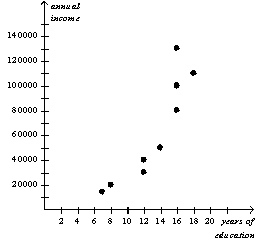
-Refer to Figure 2-17.The graph above is a
A) bar graph
B) scatterplot
C) pie chart
D) time series analysis
Correct Answer:
Verified
Q8: Economists try to address their subject with
Q63: The argument that purchases of minivans cause
Q64: Alfonso has noticed that increases in unemployment
Q386: Figure 2-16
In the following graph the x-axis
Q387: Figure 2-15
Relationship between Price and Cups of
Q392: Figure 2-16
In the following graph the x-axis
Q393: Figure 2-15
Relationship between Price and Cups of
Q394: Figure 2-15
Relationship between Price and Cups of
Q395: Figure 2-15
Relationship between Price and Cups of
Q396: Figure 2-15
Relationship between Price and Cups of
Unlock this Answer For Free Now!
View this answer and more for free by performing one of the following actions

Scan the QR code to install the App and get 2 free unlocks

Unlock quizzes for free by uploading documents