Refer to the figure below. At the original market equilibrium: 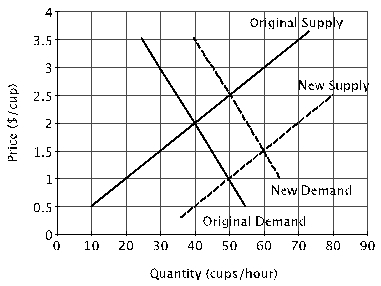
A) 50 cups are sold per hour at a price of $1.00 each.
B) 50 cups are sold per hour at a price of $2.50 each.
C) 40 cups are sold per hour at a price of $2.00 each.
D) 60 cups are sold per hour at a price of $1.50 each.
Correct Answer:
Verified
Q104: Refer to the figure below. A decrease
Q105: Refer to the figure below. An increase
Q106: Refer to the figure below. Suppose the
Q107: Refer to the figure below. An increase
Q108: Refer to the figure below. What might
Q110: Refer to the figure below. A decrease
Q111: What might cause a decrease in supply
Q113: Refer to the figure below. Consider the
Q114: Refer to the table below. Suppose the
Q140: An increase in the demand for GM
Unlock this Answer For Free Now!
View this answer and more for free by performing one of the following actions

Scan the QR code to install the App and get 2 free unlocks

Unlock quizzes for free by uploading documents