Refer to the figure below. An increase in demand is represented by a shift from: 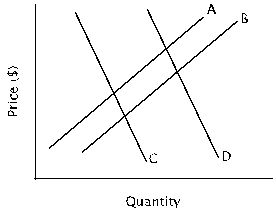
A) curve A to curve B.
B) curve B to curve A.
C) curve C to curve D.
D) curve D to curve C.
Correct Answer:
Verified
Q101: Refer to the table below. Suppose the
Q102: Refer to the table below. Relative to
Q103: Refer to the figure below. If all
Q104: Refer to the figure below. A decrease
Q106: Refer to the figure below. Suppose the
Q107: Refer to the figure below. An increase
Q108: Refer to the figure below. What might
Q109: Refer to the figure below. At the
Q110: Refer to the figure below. A decrease
Q114: Which of the following would cause an
Unlock this Answer For Free Now!
View this answer and more for free by performing one of the following actions

Scan the QR code to install the App and get 2 free unlocks

Unlock quizzes for free by uploading documents