Figure 2.2 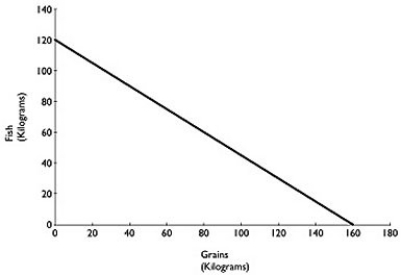 Figure 2.2 above shows the production possibilities frontier for Atikamekw Cree (ca.1600) with a historical tradition of fishing and farming.Assume they produce two goods: fish and grains.
Alt text for Figure 2.2: In figure 2.2, a graph compares production of grains and fish.
Long description for Figure 2.2: The x-axis is labelled, grains in kilograms, and the y-axis is labelled, fish in kilograms.The x-axis is marked from 0 to 180, in increments of 20.The y-axis is marked from 0 to 140, in increments of 20.A line slopes down from the point 0, 120 to the point 160, 0.
-Refer to Figure 2.2.Suppose Atikamekw Cree are currently producing 60 kilograms of grain per period.How much fish is it also producing, assuming that resources are fully utilized?
A) 45 kilograms of fish
B) 75 kilograms of fish
C) 80 kilograms of fish
D) 100 kilograms of fish
Correct Answer:
Verified
Q4: If the production possibilities frontier is _,
Q6: The points outside the production possibilities frontier
Q9: The production possibilities frontier model shows that
A)if
Q10: Figure 2.2 Q12: The attainable production points on a production![]()

