Figure 2.2 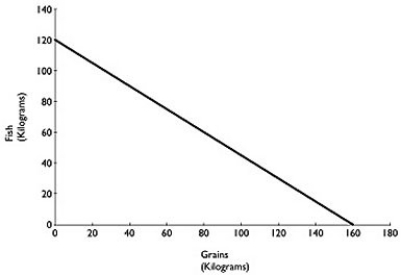 Figure 2.2 above shows the production possibilities frontier for Atikamekw Cree (ca.1600) with a historical tradition of fishing and farming.Assume they produce two goods: fish and grains.
Alt text for Figure 2.2: In figure 2.2, a graph compares production of grains and fish.
Long description for Figure 2.2: The x-axis is labelled, grains in kilograms, and the y-axis is labelled, fish in kilograms.The x-axis is marked from 0 to 180, in increments of 20.The y-axis is marked from 0 to 140, in increments of 20.A line slopes down from the point 0, 120 to the point 160, 0.
-Refer to Figure 2.2.The linear production possibilities frontier in the figure indicates that
A) Atikamekw Cree have a comparative advantage in the production of vegetables.
B) Atikamekw Cree have a comparative disadvantage in the production of meat.
C) the trade-off between producing fish and grain is constant.
D) it is progressively more expensive to produce fish.
Correct Answer:
Verified
Q4: If the production possibilities frontier is _,
Q6: The points outside the production possibilities frontier
Q9: The production possibilities frontier model shows that
A)if
Q10: Figure 2.2 Q12: The attainable production points on a production Q13: Figure 2.2 Q14: Figure 2.2 Q15: The production possibilities frontier shows the _ Q15: Scarcity Q20: Figure 2-1 Unlock this Answer For Free Now! View this answer and more for free by performing one of the following actions Scan the QR code to install the App and get 2 free unlocks Unlock quizzes for free by uploading documents![]()
![]()
![]()
A)stems from the incompatibility between limited resources
![]()

