Figure 2.4 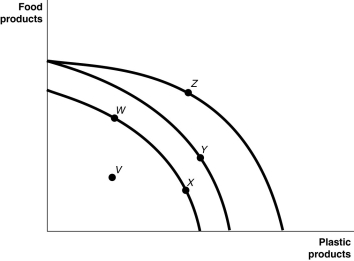 Figure 2.4 shows various points on three different production possibilities frontiers for a nation.
Alt text for Figure 2.4: In figure 2.4, a graph illustrates 3 different production possibilities.
Long description for Figure 2.4: The x-axis is labelled, plastic products, and the y-axis is labelled, food products.3 convex curves are shown, with points V, W, X, Y, and Z plotted.The first curve begins just past the half-way point on the y-axis, and ends just past the half-way point on the x-axis.Points W and X are plotted along the curve, with point W approximately 1 third of the way from the start of the curve, and point X more than 2 thirds of the way along the curve.The second curve begins almost 3 quarters of the way up the y-axis and ends just past the termination of the first curve on the x-axis.Point Y is plotted on the second curve, approximately 2 thirds of the way along the curve.The third curve begins at the same point as the second curve, and ends approximately 3 quarters of the way along the x-axis.Point Z is plotted on the third curve, a little less than half-way along the curve.Point V is plotted between the first curve and the origin.
-Refer to Figure 2.4.A movement from X to Y
A) could be due to a change in consumers' tastes and preferences.
B) could occur because of an influx of immigrant labour.
C) is the result of advancements in food production technology only, with no change in the technology for plastic production.
D) is the result of advancements in plastic production technology only, with no change in food production technology.
Correct Answer:
Verified
Q23: Table 2-1
Production choices for Tomaso's Trattoria
Q33: If opportunity costs are constant, the production
Q37: Increasing opportunity cost is represented by a
Q38: An inward shift of a nation's production

