Figure 2.5 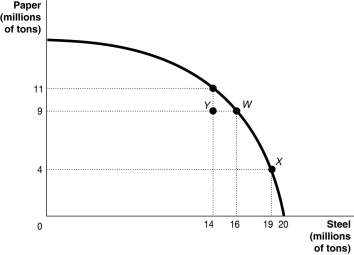 Alt text for Figure 2.5: In figure 2.5, a graph compares paper and steel production.
Long description for Figure 2.5: The x-axis is labelled, steel in millions of tons and the quantities 14, 16, 19, and 20 are marked.The y-axis is labelled, paper in millions of tons, and the quantities 4, 9, and 11 are marked.Points Y(14, 9) , W(16, 9) , (19, 4) , and an unnamed point (14, 11) are plotted on the graph, and joined to the respective axes using dotted lines.A concave curve is drawn from the y-axis to the x-axis, passing through the unnamed point (14, 11) , and points W(16, 9) , and X(19, 4) .Point Y is between the curve and the axes.
-Refer to Figure 2.5. If this economy is currently considering switching from point X to point W, what is the opportunity cost of each newly produced ton of paper?
A) 0.6 tons of steel
B) 3 tons of steel
C) 1.67 tons of paper
D) 5 tons of paper.
Correct Answer:
Verified
Q33: If opportunity costs are constant, the production
Q38: An inward shift of a nation's production
Q40: Figure 2.4 Q44: The federal government supports health care spending Q45: Suppose there is no unemployment in the Q47: As provincial governments across Canada face growing Q48: Figure 2.6 Q50: Figure 2-4 Q82: If a country is producing efficiently and Q180: Figure 2-11 Unlock this Answer For Free Now! View this answer and more for free by performing one of the following actions Scan the QR code to install the App and get 2 free unlocks Unlock quizzes for free by uploading documents![]()
![]()
![]()
![]()

