Figure 2.14 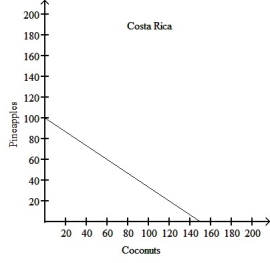
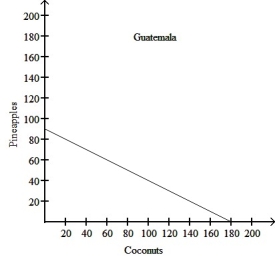 Figure 2.14 shows the production possibilities frontiers for Costa Rica and Guatemala.Each country produces two goods, pineapples and coconuts.
Alt text for Figure 2.14: In figure 2.14, 2 graphs show the production possibilities frontiers for Costa Rica and Guatemala.
Long description for Figure 2.14: The graph on the left represents Costa Rica.The x-axis is labelled, coconuts, and is marked from 20 to 200 in increments of 20.The y-axis is labelled, pineapples, and is marked from 20 to 200 in increments of 20.A slanted line is drawn from point 100 on the y-axis to point 150 on the x-axis.The graph on the right represents Guatemala.The x-axis is labelled, coconuts, and is marked from 20 to 200 in increments of 20.The y-axis is labelled, pineapples, and is marked from 20 to 200 in increments of 20.A slanted line is drawn from point 90 on the y-axis to point 180 on the x-axis.
-Refer to Figure 2.14.What is the opportunity cost of producing 1 tonne of coconuts in Guatemala?
A) 1/2 of a tonne of pineapples
B) 1 1/3 tonnes of pineapples
C) 2 tonnes of pineapples
D) 90 tonnes of pineapples
Correct Answer:
Verified

