Figure 2.14 
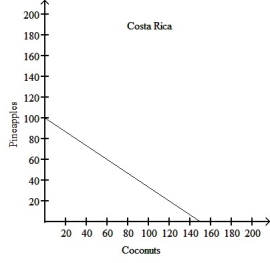
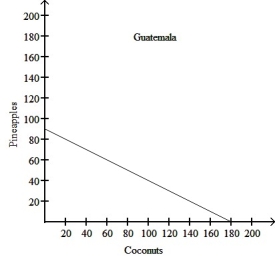
 Figure 2.14 shows the production possibilities frontiers for Costa Rica and Guatemala.Each country produces two goods, pineapples and coconuts.
Alt text for Figure 2.14: In figure 2.14, 2 graphs show the production possibilities frontiers for Costa Rica and Guatemala.
Long description for Figure 2.14: The graph on the left represents Costa Rica.The x-axis is labelled, coconuts, and is marked from 20 to 200 in increments of 20.The y-axis is labelled, pineapples, and is marked from 20 to 200 in increments of 20.A slanted line is drawn from point 100 on the y-axis to point 150 on the x-axis.The graph on the right represents Guatemala.The x-axis is labelled, coconuts, and is marked from 20 to 200 in increments of 20.The y-axis is labelled, pineapples, and is marked from 20 to 200 in increments of 20.A slanted line is drawn from point 90 on the y-axis to point 180 on the x-axis.
-Refer to Figure 2.14.If the two countries have the same amount of resources and the same technological knowledge, which country has an absolute advantage in the production of both pineapples and coconuts?
A) Guatemala
B) Neither country
C) Costa Rica
D) An absolute advantage cannot be determined
Correct Answer:
Verified

