Figure 3.5 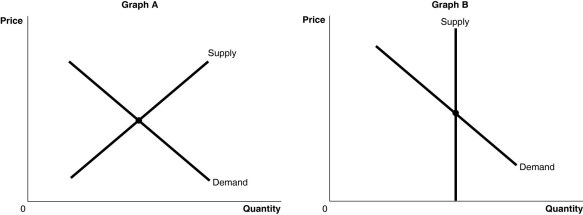 Alt text for Figure 3.5a: In figure 3.5a, a graph of intersecting supply and demand curves representing the markets for original Picasso paintings and designer jeans.
Long description for Figure 3.5a: The x-axis is labelled, Quantity, and the y-axis is labelled, Price.Curve Supply is a straight line which slopes up from the bottom left corner to the top right corner.Curve Demand is a straight line which slopes down from the top left corner to the bottom right corner.The 2 curves intersect at their respective midpoints.
Alt text for Figure 3.5b: In figure 3.5b, a graph of intersecting supply and demand curves represents one of the two markets for original Picasso paintings and designer jeans.
Long description for Figure 3.5b: The x-axis is labelled, Quantity, and the y-axis is labelled, Price.Curve Demand is a straight line which slopes down from the top left corner to the bottom right corner.Curve Supply is a straight, vertical line beginning from approximate midpoint of the x axis.The 2 curves intersect at their respective midpoints.
-Refer to Figure 3.5.The figure above shows the supply and demand curves for two markets: the market for original Picasso paintings and the market for designer jeans.Which graph most likely represents which market?
A) Graph B represents the market for original Picasso paintings and Graph A represents the market for designer jeans.
B) Graph A represents the market for original Picasso paintings and Graph B represents the market for designer jeans.
C) Graph A represents both the market for original Picasso paintings and designer jeans.
D) Graph B represents both the market for original Picasso paintings and designer jeans.
Correct Answer:
Verified
Q104: A decrease in the price of inputs
Q125: At a product's equilibrium price
A)the product's demand
Q136: Which of the following is the correct
Q140: What are the five most important variables
Q142: In a perfectly competitive market, there are
Q167: Indicate whether each of the following situations
Q168: Assume there is a shortage in the
Unlock this Answer For Free Now!
View this answer and more for free by performing one of the following actions

Scan the QR code to install the App and get 2 free unlocks

Unlock quizzes for free by uploading documents