Figure 3.7 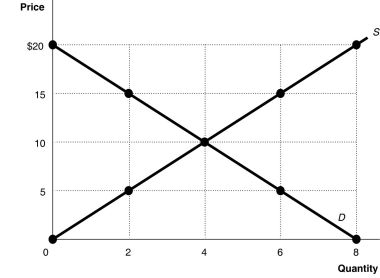 Alt text for Figure 3.7: In figure 3.7, a graph plotting intersecting supply and demand curves illustrates surplus and shortage in a market, along with an equilibrium.
Long description for Figure 3.7: The x-axis is labelled, Quantity, and is marked from 0 to 8 in increments of 2.The y-axis is labelled, Price, and is marked from 0 to 20 dollars in increments of 5.Curve D is a straight line which slopes down from the top left corner to the bottom right corner.Curve S is a straight line which begins in the bottom left corner and slopes up to the top right corner.The equilibrium of the 2 curves is marked at (4,10) .2 points plotted on the demand curve to the left of the equilibrium are (0,20) and (2,15) .2 points plotted on the demand curve to the right of the equilibrium are (6,5) and (8,0) .2 points plotted on the supply curve to the right of the equilibrium are (6,15) and (8,20) .2 points plotted on the supply curve to the left of the equilibrium are (2,5) and (0,0) .
-Refer to Figure 3.7.At a price of $15,
A) there would be a surplus of 4 units.
B) there would be a shortage of 2 units.
C) there would be a surplus of 6 units.
D) there would be a shortage of 4 units.
Correct Answer:
Verified
Q104: A decrease in the price of inputs
Q125: At a product's equilibrium price
A)the product's demand
Q136: Which of the following is the correct
Q142: In a perfectly competitive market, there are
Q167: Indicate whether each of the following situations
Q168: Assume there is a shortage in the
Q171: Figure 3.5 Q175: Figure 3.6 Q176: When all else equal, as the price Q177: Figure 3.8 Unlock this Answer For Free Now! View this answer and more for free by performing one of the following actions Scan the QR code to install the App and get 2 free unlocks Unlock quizzes for free by uploading documents![]()
![]()
![]()

