Figure 11.15 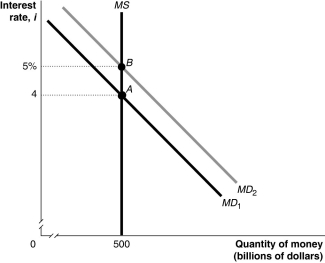 Alt text for Figure 11.15: In figure 11.15, a graph comparing quantity of money and interest rate.
Long description for Figure 11.15: The x-axis is labelled, quantity of money (billions of dollars) .The y-axis is labelled, interest rate, i.3 lines are shown; MD1, MD2, and MS.Line MD1 begins at the top left corner and slopes down to the end of the x-axis.Line MD2 follows the same slope as MD1, but is plotted to the right.Line MS is perpendicular to the x-axis, and begins from the x-axis value 500.Line MD1 intersects line MS at point A (500, 4) .Line MD2 intersects line MS at point B (500, 5%) .Points A and B are connected to their respective coordinates on the y-axis with dotted lines.
-Refer to Figure 11.15.In the figure above, if the economy in Year 1 is at point A and expected in Year 2 to be at point B, then the appropriate monetary policy by the Bank of Canada would be to
A) expand the money supply.
B) reduce the money supply.
C) lower income taxes.
D) raise income taxes.
E) reduce the exchange rate.
Correct Answer:
Verified
Q159: Figure 11.13 Q161: The Bank of Canada can use expansionary![]()

