Figure 11.18 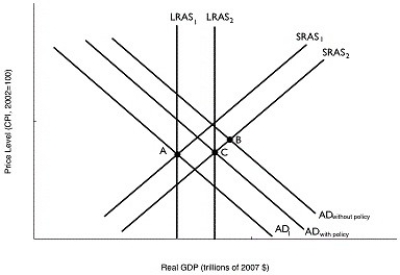 Alt text for Figure 11.18: In figure 11.18, a graph comparing real GDP and price level.
Long description for Figure 11.18: The x-axis is labelled, real GDP (trillions of 2007 dollars) .The y-axis is labelled, price level (CPI, 2002 = 100) .7 lines are shown; SRAS1, SRAS2, AD1, AD without policy, AD with policy, LRAS1, and LRAS2.Line SRAS1 begins near the bottom left corner and slopes up to the top right corner.Line SRAS2 follows the same slope as line SRAS1, but is plotted to the right.Line AD1 begins at the top left corner and slopes down toward the end of the x-axis.Lines AD without policy, and AD with policy, follow the same slope as line AD1, but are plotted to the right.Lines LRAS1 and LRAS2 are perpendicular to the x-axis such that line LRAS2 is to the right of line LRAS1.Line LRAS1 intersects lines AD1 and SRAS1 at point A.Lines AD without policy, and SRAS2 intersect at point B.Line LRAS2 intersects the lines AD with policy, and SRAS2 at point C.
-Refer to Figure 11.18.In the figure above, suppose the economy in Year 1 is at point A and is expected in Year 2 to be at point B.Which of the following policies could the Bank of Canada use to move the economy to point C?
A) decrease income taxes
B) decrease the desired reserve ratio
C) buy government securities
D) sell government securities
E) extend additional loans to commercial banks
Correct Answer:
Verified
Q162: Table 11.4 Q163: Figure 11.15 Q164: Table 11.5 Q165: Table 11.9 Q166: The Bank of Canada can use contractionary Q168: Use the dynamic aggregate demand and aggregate Q169: From an initial long-run macroeconomic equilibrium, if Q170: Figure 11.17 Q171: The Bank of Canada is able to Q172: Table 11.8 Unlock this Answer For Free Now! View this answer and more for free by performing one of the following actions Scan the QR code to install the App and get 2 free unlocks Unlock quizzes for free by uploading documents![]()
![]()
![]()
![]()
![]()
![]()

