Figure 13.1 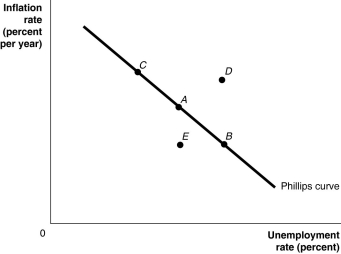 Alt text for Figure 13.1: In figure 13.1, a short-run Phillips curve.
Long description for Figure 13.1: The x-axis is labelled, unemployment rate percent, and the y-axis is labelled, inflation rate percent per year.A straight line labelled, Philips curve, begins at the top left corner and slopes down to the end of the x-axis.Point A is plotted half way along line Philips curve.Point B is plotted to the right of point A and point C is plotted is to the left of point A.Point D is plotted above this line, in the left center of the quadrant.Point E is plotted below this line, directly below point A.
-Refer to Figure 13.1.Suppose that the economy is currently at point A, and the unemployment rate at A is the natural rate.What policy would the Bank of Canada pursue if it wanted the economy to move to point C in the long run?
A) buy government securities
B) sell government securities
C) lower the discount rate
D) increase the money supply
E) No policy will move the economy to point C in the long run.
Correct Answer:
Verified
Q35: Assume weak growth in aggregate demand keeps
Q47: If workers and firms expect that inflation
Q50: According to the _ Phillips curve(s), the
Q51: Shondra's real wage in 2012 is $18.50.If
Unlock this Answer For Free Now!
View this answer and more for free by performing one of the following actions

Scan the QR code to install the App and get 2 free unlocks

Unlock quizzes for free by uploading documents