Figure 13.1 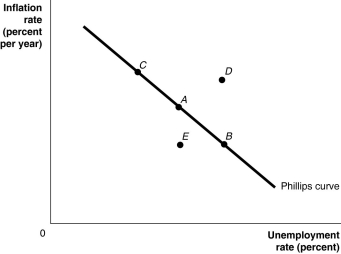 Alt text for Figure 13.1: In figure 13.1, a short-run Phillips curve.
Long description for Figure 13.1: The x-axis is labelled, unemployment rate percent, and the y-axis is labelled, inflation rate percent per year.A straight line labelled, Philips curve, begins at the top left corner and slopes down to the end of the x-axis.Point A is plotted half way along line Philips curve.Point B is plotted to the right of point A and point C is plotted is to the left of point A.Point D is plotted above this line, in the left center of the quadrant.Point E is plotted below this line, directly below point A.
-Refer to Figure 13.1.What should the Bank of Canada do if it wants to move from point A to point C in the short-run Phillips curve depicted in the figure above?
A) buy government securities
B) sell government securities
C) raise the discount rate
D) decrease the money supply
E) raise taxes
Correct Answer:
Verified
Q35: Assume weak growth in aggregate demand keeps
Q47: Figure 13.1 Q47: If workers and firms expect that inflation Q48: Figure 13.1 Q50: According to the _ Phillips curve(s), the Q51: Shondra's real wage in 2012 is $18.50.If Q53: According to the short-run Phillips curve, which Unlock this Answer For Free Now! View this answer and more for free by performing one of the following actions Scan the QR code to install the App and get 2 free unlocks Unlock quizzes for free by uploading documents![]()
![]()

