Figure 13.1 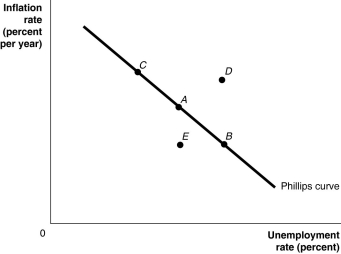 Alt text for Figure 13.1: In figure 13.1, a short-run Phillips curve.
Long description for Figure 13.1: The x-axis is labelled, unemployment rate percent, and the y-axis is labelled, inflation rate percent per year.A straight line labelled, Philips curve, begins at the top left corner and slopes down to the end of the x-axis.Point A is plotted half way along line Philips curve.Point B is plotted to the right of point A and point C is plotted is to the left of point A.Point D is plotted above this line, in the left center of the quadrant.Point E is plotted below this line, directly below point A.
-Refer to Figure 13.1.Suppose that the economy is currently at point A on the short-run Phillips curve in the figure above, and the unemployment rate at A is the natural rate.If the economy was to move to point B, which of the following must be true?
A) The economy is producing a level of GDP equal to potential GDP.
B) Aggregate demand must have increased.
C) Equilibrium GDP at point B must be below potential GDP.
D) The Bank of Canada conducted expansionary policy to cause the move.
E) The Bank of Canada purchased government securities to cause the move.
Correct Answer:
Verified
Q35: Assume weak growth in aggregate demand keeps
Q38: In a graph of unemployment rates (on
Q44: The price level in the economy between
Q46: Employees at the hospital have negotiated a
Q47: Figure 13.1 Q50: According to the _ Phillips curve(s), the Q51: Shondra's real wage in 2012 is $18.50.If![]()
Unlock this Answer For Free Now!
View this answer and more for free by performing one of the following actions

Scan the QR code to install the App and get 2 free unlocks

Unlock quizzes for free by uploading documents