Figure 13.10 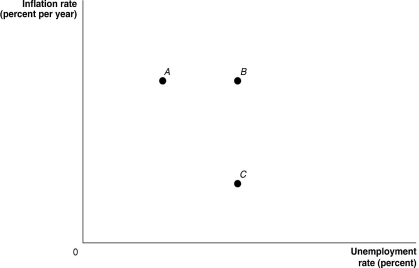 Alt text for Figure 13.10: In figure 13.10, a graph comparing unemployment rate and inflation rate.
Long description for Figure 13.10: The x-axis is labelled, unemployment rate percent, and the y-axis is labelled, inflation rate percent per year.3 points; A, B, and C are plotted such that A and B share equivalent y-axis values, and B and C share equivalent x-axis values.
-Refer to Figure 13.10.A response to persistent ________ due to ongoing expansionary monetary policy is depicted in the figure above as a movement from C to A to B.
A) deflation
B) high unemployment
C) high inflation
D) appreciation of the dollar
E) falling expectations of inflation
Correct Answer:
Verified
Q242: Leverage is
A)a measure of the level of
Q243: The 1989-1993 Bank of Canada adoption of
Q244: If the Bank of Canada's announcements about
Q245: If the Bank of Canada announces that
Q246: If the Bank of Canada chooses to
Q248: Deflation refers to
A)a decrease in the rate
Unlock this Answer For Free Now!
View this answer and more for free by performing one of the following actions

Scan the QR code to install the App and get 2 free unlocks

Unlock quizzes for free by uploading documents