Figure 15.3 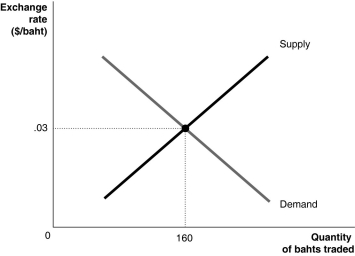 Alt text for Figure 15.3: In figure 15.3, a graph illustrates the quantity of bahts traded against the exchange rate.
Long description for Figure 15.3: The x-axis is labelled, quantity of bahts traded, with value 180 marked.The y-axis is labelled exchange rate, Canadian dollar against the baht, with value 0.03 marked.A straight line supply curve, S, slopes up from the bottom left corner to the top right corner.A straight line demand curve, D, slopes down from the top left corner to the bottom right corner.Curves S and D intersect at point (160, 0.30) , which is connected to the corresponding x and y-axes values with dotted lines.
-Refer to Figure 15.3.Which of the following is not true?
A) Canadian imports are cheaper at exchange rates greater than $.03/baht than at the equilibrium exchange rate.
B) The baht is overvalued at exchange rates greater than $.03/baht.
C) To achieve an exchange rate greater than $.03/baht, the Bank of Thailand must buy surplus dollars with bahts.
D) Thai exports to Canada are more expensive at exchange rates greater than $.03/baht than at the equilibrium exchange rate.
E) If the price of baht is 0.04, the demand for baht will be greater than 160.
Correct Answer:
Verified
Q82: Figure 15.3 Q83: Figure 15.4 Q84: Figure 15.5 Q86: Pegging a country's exchange rate to the Q88: You are made better off in which Q89: Figure 15.3 Q90: If a country's currency is "pegged" to Q91: Members of the European Union decided to Q92: Figure 15.4 Q93: The currencies of Poland and Iceland (the Unlock this Answer For Free Now! View this answer and more for free by performing one of the following actions Scan the QR code to install the App and get 2 free unlocks Unlock quizzes for free by uploading documents![]()
![]()
![]()
![]()
![]()

