Multiple Choice
Figure 4-5 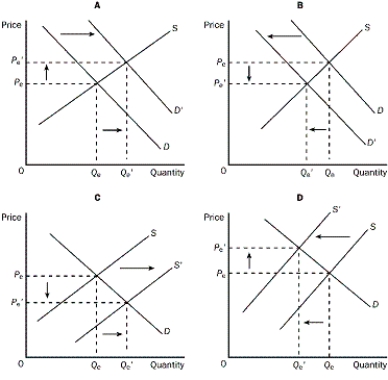
-Refer to Figure 4-5. Which of the four graphs represents the market for peanut butter after a major hurricane hits the peanut-growing area?
A) graph A
B) graph B
C) graph C
D) graph D
Correct Answer:
Verified
Related Questions
Q40: Suppose roses are currently selling for $40.00
Q41: What will result from a decrease in
Q42: Which chain of events occurs in the
Q43: You have been asked by your economics

