Multiple Choice
Figure 4-5 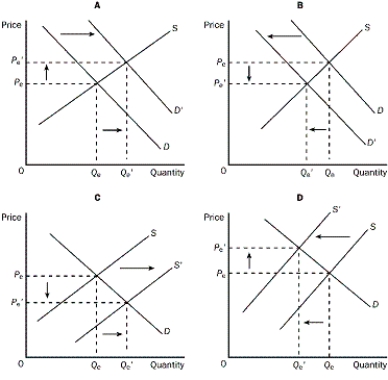
-Refer to Figure 4-5. Graph C shows which of the following?
A) an increase in demand
B) an increase in quantity demanded
C) an increase in supply
D) an increase in input prices.
Correct Answer:
Verified
Related Questions
Q45: What would an early frost in the
Q46: Figure 4-5 ![]()

