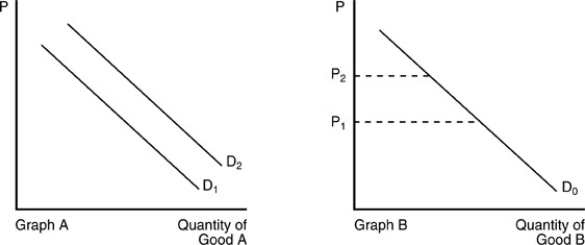
-In the above figure, an increase in income is best demonstrated by a
A) shift of D1 to D2 in Graph A, if good A is a normal good.
B) shift of D2 to D1 in Graph A, if good A is a normal good.
C) movement along D0 from P1 to P2 in Graph B.
D) movement along D0 from P2 to P1 in Graph B.
Correct Answer:
Verified
Q126: Suppose that goods X and Y are
Q146: If the price of apples goes down,
Q148: After the price of music downloads falls,
Q149: Q152: We observe that people buy less steak Q154: An increase in demand for a good Q154: Suppose Good A is a normal good. Q155: Of the following, which is the least Q156: If the price of hot dogs increases, Q158: ![]()
![]()
Unlock this Answer For Free Now!
View this answer and more for free by performing one of the following actions

Scan the QR code to install the App and get 2 free unlocks

Unlock quizzes for free by uploading documents