Multiple Choice
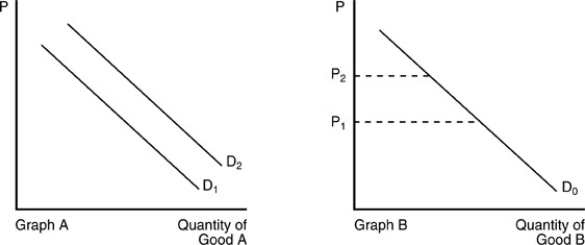
-In the above figure, the demand curve for Good A shifts from D1 to D2 in Graph A when the price of Good B changes from P1 to P2 in Graph B. We can conclude that
A) Good A and Good B are substitutes.
B) Good A and Good B are complements.
C) Good A is a normal good but Good B is an inferior good.
D) Good A and Good B are unrelated.
Correct Answer:
Verified
Related Questions
Q123: If two goods are substitutes, then
A) an
Q126: Suppose that goods X and Y are
Q147: Suppose a concert by Lady Gaga and
Q148: After the price of music downloads falls,
Unlock this Answer For Free Now!
View this answer and more for free by performing one of the following actions

Scan the QR code to install the App and get 2 free unlocks

Unlock quizzes for free by uploading documents