Graph 2-1
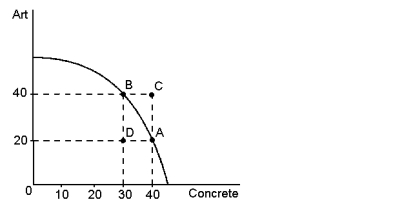
-Refer to Graph 2-1. In the graph shown, the opportunity cost to the economy of moving from point A to point B is 10 units of concrete.
Correct Answer:
Verified
Q9: An economy will always operate at some
Q21: Microeconomics is the study of decision making
Q22: The circular-flow diagram and the production possibilities
Q23: Graph 2-1 Q26: The efficient production points for the production Q34: Given a two-good production possibilities frontier, a Q48: If an economist develops a theory about Q57: The scientific method can best be defined Q59: Economists may disagree on how the government Q231: When economists are trying to explain the![]()
Unlock this Answer For Free Now!
View this answer and more for free by performing one of the following actions

Scan the QR code to install the App and get 2 free unlocks

Unlock quizzes for free by uploading documents