Multiple Choice
Figure 2-12 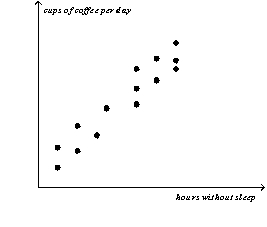
-Refer to Figure 2-12.The graph shown is known as a
A) time-series graph.
B) bar graph.
C) scatterplot.
D) pie chart.
Correct Answer:
Verified
Related Questions
Q24: When two variables have a negative correlation,
A)when
Q28: Suppose price is measured along the vertical
Q34: When two variables move in the same
Q38: When two variables move in opposite directions,the
Q48: The slope of a line is equal
Q57: The slope of a line is equal
Q265: When a relevant variable that is not

