Figure 2-13 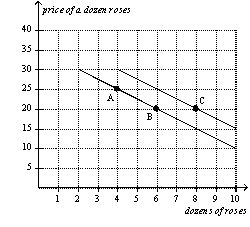
-Refer to Figure 2-13.The curves shown are
A) supply curves.
B) demand curves.
C) preference curves.
D) income-consumption curves.
Correct Answer:
Verified
Q2: When two variables have a positive correlation,
A)when
Q3: When two variables have a positive correlation,
A)they
Q23: A demand curve shows the relationship
A)between income
Q29: When two variables have a negative correlation,
A)they
Q34: When two variables move in the same
Q38: When two variables move in opposite directions,the
Q48: The slope of a line is equal
Q265: When a relevant variable that is not
Q426: Figure 2-12 Q434: Figure 2-13 ![]()
![]()
Unlock this Answer For Free Now!
View this answer and more for free by performing one of the following actions

Scan the QR code to install the App and get 2 free unlocks

Unlock quizzes for free by uploading documents