Multiple Choice
Figure 2-13 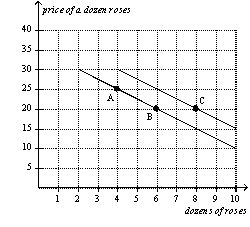
-Refer to Figure 2-10.The slope of the curve between points A and B is
A) -5/2
B) -2/5
C) 2/5
D) 5/2
Correct Answer:
Verified
Related Questions
Q2: When two variables have a positive correlation,
A)when
Q3: When two variables have a positive correlation,
A)they
Q23: A demand curve shows the relationship
A)between income
Q29: When two variables have a negative correlation,
A)they
Q34: When two variables move in the same
Q38: When two variables move in opposite directions,the

