Multiple Choice
Figure 2-13 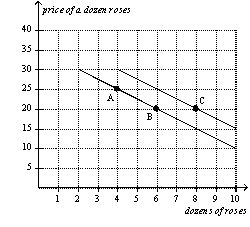
-Refer to Figure 2-13.The movement from point B to point C is a(n)
A) shift of the demand curve.
B) movement along the demand curve.
C) indication that the price of roses has changed.
D) indication that the costs incurred by firms that produce roses have changed.
Correct Answer:
Verified
Related Questions
Q2: When two variables have a positive correlation,
A)when
Q3: When two variables have a positive correlation,
A)they
Q23: A demand curve shows the relationship
A)between income
Q29: When two variables have a negative correlation,
A)they
Q56: Suppose that someone makes the argument that
Q62: In the early 19th century,the Russian government

