Multiple Choice
Figure 13-6 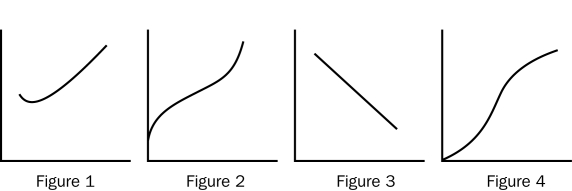
-Refer to Figure 13-6.Which of the figures represents the total cost curve for a firm?
A) Figure 1
B) Figure 2
C) Figure 3
D) Figure 4
Correct Answer:
Verified
Related Questions
Q86: Figure 13-4
The curves in this figure reflect
Q134: The minimum points of the average variable
Q345: Figure 13-4 Q346: Scenario 13-8![]()
Suppose that a given firm experiences

