Figure 13-6 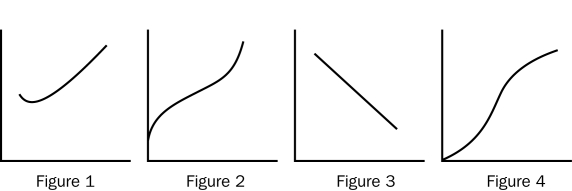
-Refer to Figure 13-6.Which of the figures represents the production function for a firm?
A) Figure 1
B) Figure 2
C) Figure 3
D) Figure 4
Correct Answer:
Verified
Q86: Figure 13-4
The curves in this figure reflect
Q134: The minimum points of the average variable
Q342: Scenario 13-8
Suppose that a given firm experiences
Q345: Figure 13-4 Q346: Scenario 13-8 Q348: Figure 13-6 Q349: Figure 13-5 Q351: Scenario 13-8 Q352: Figure 13-4 Q369: The marginal cost curve crosses the average Unlock this Answer For Free Now! View this answer and more for free by performing one of the following actions Scan the QR code to install the App and get 2 free unlocks Unlock quizzes for free by uploading documents![]()
Suppose that a given firm experiences![]()
![]()
Suppose that a given firm experiences![]()

