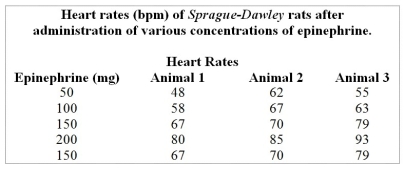
Table 1.1
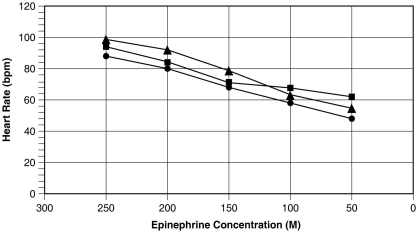
Figure 1.1
Use the table and graph below to answer the following questions.
-Referring to Figure 1.2, at approximately what age do men begin to show higher systolic blood pressures than women? At what age does this trend reverse?
Correct Answer:
Verified
View Answer
Unlock this answer now
Get Access to more Verified Answers free of charge
Q50: Table 1.1 Q51: What is a hypothesis? What are the Q52: Provide an example of a control system.Be Q53: High cholesterol levels have been shown to Q54: Table 1.1 Q56: Write a teleological explanation for why heart Unlock this Answer For Free Now! View this answer and more for free by performing one of the following actions Scan the QR code to install the App and get 2 free unlocks Unlock quizzes for free by uploading documents
![]()
![]()

