Figure 19-1 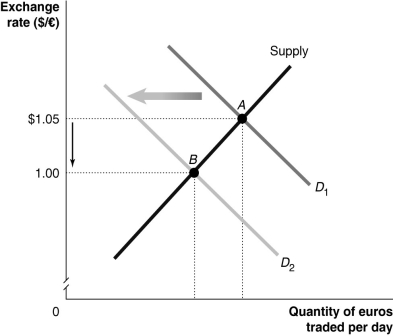
-Refer to Figure 19-1.Which of the following would cause the change depicted in the figure above?
A) U.S.productivity rises relative to European productivity.
B) Europeans decrease their preferences for U.S.goods relative to European goods.
C) The European Union increases its quotas on U.S.-produced wine.
D) an increase in the price level of U.S.goods relative to European goods
Correct Answer:
Verified
Q69: Figure 19-1 Q70: If the GDP deflator in the United Q71: Suppose the GDP deflator in the United Q72: Because the value of the euro is Q73: If,at the current exchange rate between the Q75: If inflation in Russia is higher than Q76: The "Big Mac Theory of Exchange Rates" Q77: If the GDP deflator in the United Q78: If the implied exchange rate between Big Q79: If the purchasing power of the dollar![]()
Unlock this Answer For Free Now!
View this answer and more for free by performing one of the following actions

Scan the QR code to install the App and get 2 free unlocks

Unlock quizzes for free by uploading documents