Figure 19-1 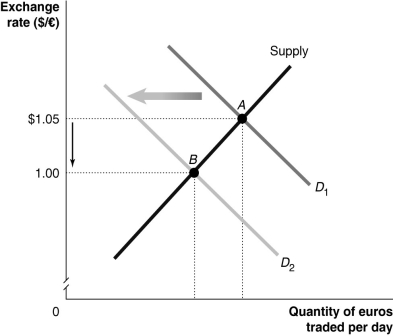
-Refer to Figure 19-1.Which of the following would cause the change depicted in the figure above?
A) U.S.productivity falls relative to European productivity.
B) Americans increase their preferences for goods produced in the EU relative to American goods.
C) The United States imposes a quota on wine from the European Union.
D) The price level of goods produced in the EU decreases relative to the price level of goods produced in the United States.
Correct Answer:
Verified
Q64: If the average productivity of American firms
Q65: A Big Mac costs $4.00 in the
Q66: How will the exchange rate (foreign currency
Q67: If the U.S.government places tariffs on imports
Q68: Which of the following explains why purchasing
Q70: If the GDP deflator in the United
Q71: Suppose the GDP deflator in the United
Q72: Because the value of the euro is
Q73: If,at the current exchange rate between the
Q74: Figure 19-1 ![]()
Unlock this Answer For Free Now!
View this answer and more for free by performing one of the following actions

Scan the QR code to install the App and get 2 free unlocks

Unlock quizzes for free by uploading documents