Figure 19-11 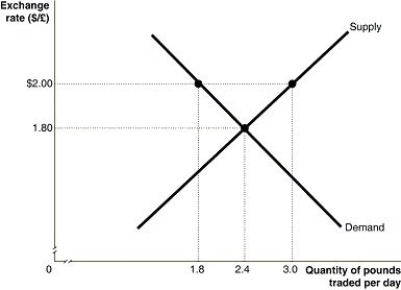
-Refer to Figure 19-11.The graph above depicts supply and demand for British pounds during a trading day,where the quantity is millions of pounds.In order to support a fixed exchange rate of $2.00 per pound,the British central bank must
A) buy 0.6 million pounds per trading day.
B) sell 0.6 million pounds per trading day.
C) buy 1.2 million pounds per trading day.
D) sell 1.2 million pounds per trading day.
Correct Answer:
Verified
Q220: Foreign purchases of U.S.government bonds _ between
Q221: In order to support an undervalued euro,the
Q222: Figure 19-10 Q223: A persistent surplus of pounds at a Q224: Figure 19-11 Q226: A persistent shortage or surplus of a Q227: In 1931,the first major country to abandon Q228: Figure 19-12 Q229: An increase in a fixed exchange rate Q230: Figure 19-12 Unlock this Answer For Free Now! View this answer and more for free by performing one of the following actions Scan the QR code to install the App and get 2 free unlocks Unlock quizzes for free by uploading documents![]()
![]()
![]()
![]()

