Figure 19-12 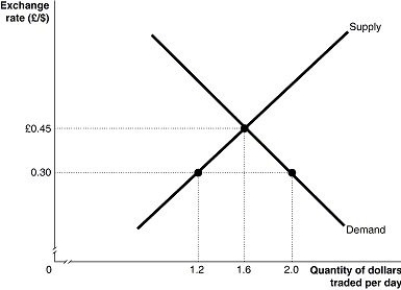
-Refer to Figure 19-12.The graph above depicts supply and demand for U.S.dollars during a trading day,where the quantity is millions of dollars.In order to support a fixed exchange rate of 0.30 pounds per dollar,the U.S.central bank must
A) buy 0.4 million dollars per trading day.
B) sell 0.4 million dollars per trading day.
C) buy 0.8 million dollars per trading day.
D) sell 0.8 million dollars per trading day.
Correct Answer:
Verified
Q225: Figure 19-11 Q226: A persistent shortage or surplus of a Q227: In 1931,the first major country to abandon Q228: Figure 19-12 Q229: An increase in a fixed exchange rate Q231: Under the Bretton Woods system,a fixed exchange Q232: The Bretton Woods system confronted severe problems Q233: A persistent shortage of yen at a Q234: Figure 19-10 Q235: Suppose the U.S.dollar is backed by one-sixth Unlock this Answer For Free Now! View this answer and more for free by performing one of the following actions Scan the QR code to install the App and get 2 free unlocks Unlock quizzes for free by uploading documents![]()
![]()
![]()

