This graph demonstrates the domestic demand and supply for a good,as well as the world price for that good. 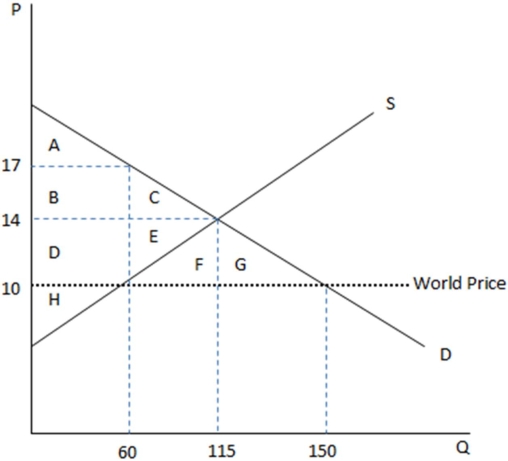
According to the graph shown,if this were depicting an autarky,the amount being bought domestically is:
A) 60 at $10 each.
B) 60 at $17 each.
C) 115 at $14 each.
D) 150 at $10 each.
Correct Answer:
Verified
Q43: This graph demonstrates the domestic demand and
Q44: This graph demonstrates the domestic demand and
Q45: This graph demonstrates the domestic demand and
Q46: Imports are goods and services that are:
A)produced
Q47: This graph demonstrates the domestic demand and
Q49: This graph demonstrates the domestic demand and
Q50: We call an economy that is self-contained
Q51: This graph demonstrates the domestic demand and
Q52: This graph demonstrates the domestic demand and
Q53: Exports are goods and services that are:
A)produced
Unlock this Answer For Free Now!
View this answer and more for free by performing one of the following actions

Scan the QR code to install the App and get 2 free unlocks

Unlock quizzes for free by uploading documents