This graph demonstrates the domestic demand and supply for a good,as well as the world price for that good. 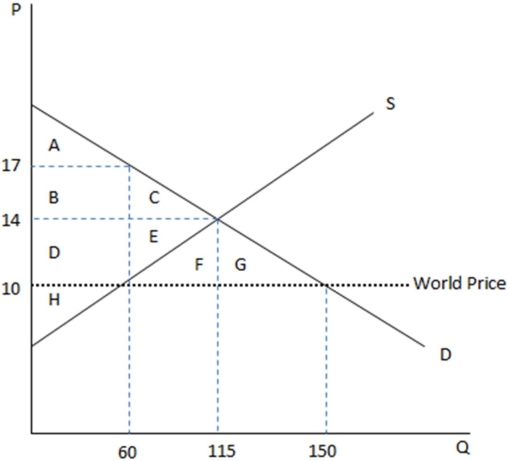
According to the graph shown,if this economy were to open to trade,domestic prices would:
A) remain $14 for domestically produced goods,and be $10 for those units imported.
B) drop to $10 for all units.
C) remain $14,with more units sold overall.
D) None of these is true.
Correct Answer:
Verified
Q39: A national characteristic that affects the cost
Q40: The right decision about what to produce
Q41: This graph demonstrates the domestic demand and
Q42: This graph demonstrates the domestic demand and
Q43: This graph demonstrates the domestic demand and
Q45: This graph demonstrates the domestic demand and
Q46: Imports are goods and services that are:
A)produced
Q47: This graph demonstrates the domestic demand and
Q48: This graph demonstrates the domestic demand and
Q49: This graph demonstrates the domestic demand and
Unlock this Answer For Free Now!
View this answer and more for free by performing one of the following actions

Scan the QR code to install the App and get 2 free unlocks

Unlock quizzes for free by uploading documents