This graph represents the cost and revenue curves of a firm in a perfectly competitive market. 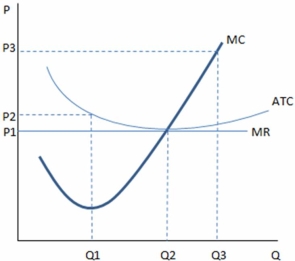
According to the graph shown,the long-run output decision for this firm is:
A) Q1,P1.
B) Q1,P2.
C) Q2,P1.
D) Q3,P3.
Correct Answer:
Verified
Q114: This graph represents the cost and revenue
Q116: When economic profits are zero for a
Q117: When firms enter a market,the supply increases
Q119: This graph represents the cost and revenue
Q120: In the long run,firms in a perfectly
Q121: In a perfectly competitive market in the
Q122: If the demand increases in a perfectly
Q138: In the long run in a perfectly
Q140: In the long run in a perfectly
Q143: If the demand in a perfectly competitive
Unlock this Answer For Free Now!
View this answer and more for free by performing one of the following actions

Scan the QR code to install the App and get 2 free unlocks

Unlock quizzes for free by uploading documents