This graph represents the cost and revenue curves of a firm in a perfectly competitive market. 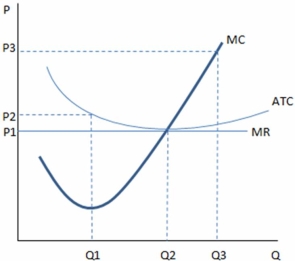
According to the graph shown,if a firm is producing at Q3:
A) profits are being maximized.
B) average total costs exceed the market price.
C) the firm should expand production.
D) All of these are true.
Correct Answer:
Verified
Q109: This graph represents the cost and revenue
Q110: This graph represents the cost and revenue
Q111: Which of the following holds true at
Q112: As the equilibrium price falls in a
Q116: When economic profits are zero for a
Q117: When firms enter a market,the supply increases
Q118: This graph represents the cost and revenue
Q119: This graph represents the cost and revenue
Q138: In the long run in a perfectly
Q140: In the long run in a perfectly
Unlock this Answer For Free Now!
View this answer and more for free by performing one of the following actions

Scan the QR code to install the App and get 2 free unlocks

Unlock quizzes for free by uploading documents