This graph represents the cost and revenue curves of a firm in a perfectly competitive market. 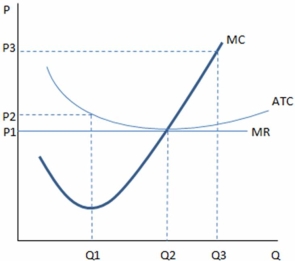
According the graph shown,the firm's most efficient scale of operation is to produce quantity:
A) Q1.
B) Q2.
C) Q3.
D) Any quantity as long as P1 is charged.
Correct Answer:
Verified
Q104: In the long run,firms in a perfectly
Q105: This graph represents the cost and revenue
Q108: When economic profits are zero for a
Q110: This graph represents the cost and revenue
Q111: Which of the following holds true at
Q112: As the equilibrium price falls in a
Q114: This graph represents the cost and revenue
Q135: Each point of a firm's supply curve
Q136: When some firms leave a perfectly competitive
Q138: In the long run in a perfectly
Unlock this Answer For Free Now!
View this answer and more for free by performing one of the following actions

Scan the QR code to install the App and get 2 free unlocks

Unlock quizzes for free by uploading documents