This graph represents the cost and revenue curves of a firm in a perfectly competitive market. 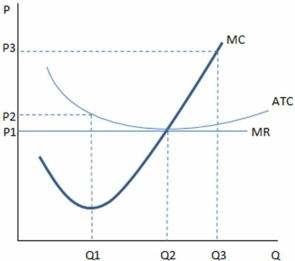
According to the graph shown,what is the market price?
A) P1
B) P2
C) P3
D) Cannot tell from the graph.
Correct Answer:
Verified
Q100: If a firm is earning a negative
Q101: This graph represents the cost and revenue
Q102: If a firm is earning a positive
Q103: In the long run,firms in a perfectly
Q104: In the long run,firms in a perfectly
Q108: When economic profits are zero for a
Q109: This graph represents the cost and revenue
Q110: This graph represents the cost and revenue
Q135: Each point of a firm's supply curve
Q136: When some firms leave a perfectly competitive
Unlock this Answer For Free Now!
View this answer and more for free by performing one of the following actions

Scan the QR code to install the App and get 2 free unlocks

Unlock quizzes for free by uploading documents