This graph represents the cost and revenue curves of a firm in a perfectly competitive market. 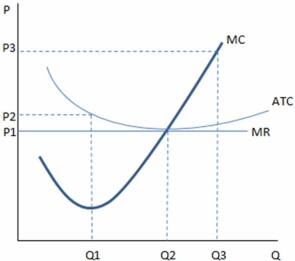
According to the graph shown,if a firm is producing at Q2,and it is identical to others in the market:
A) profits are not being maximized.
B) firms will enter this market.
C) economic profits are zero.
D) All of these are true.
Correct Answer:
Verified
Q87: The short-run shutdown rule is to shut
Q97: If the market price ever drops below
Q98: In the short run,we assume that the
Q100: If a firm is earning a negative
Q102: If a firm is earning a positive
Q103: In the long run,firms in a perfectly
Q104: In the long run,firms in a perfectly
Q105: This graph represents the cost and revenue
Q117: We assume that in the short run
Q136: When some firms leave a perfectly competitive
Unlock this Answer For Free Now!
View this answer and more for free by performing one of the following actions

Scan the QR code to install the App and get 2 free unlocks

Unlock quizzes for free by uploading documents