This graph depicts the demand for a normal good. 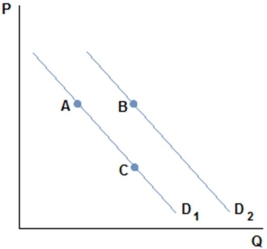
A movement from A to B in the graph shown might be caused by:
A) an increase in price.
B) a decrease in price.
C) an increase in income.
D) a decrease in income.
Correct Answer:
Verified
Q46: An expectation of increased prices of a
Q74: The price of dog collars,a normal good,has
Q75: There has been a decrease in the
Q76: This graph depicts the demand for a
Q78: Darren loves to go to the movies,and
Q80: The price of house paint,a normal good,has
Q81: A supply curve:
A)visually displays the supply schedule.
B)is
Q83: Supply describes how much of something producers:
A)are
Q87: For almost all goods,the:
A) lower the price
Q92: Wendell just read an article that says
Unlock this Answer For Free Now!
View this answer and more for free by performing one of the following actions

Scan the QR code to install the App and get 2 free unlocks

Unlock quizzes for free by uploading documents