This graph depicts the demand for a normal good. 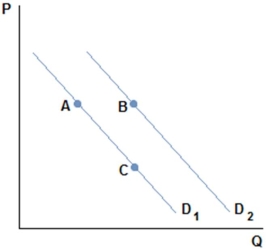
A movement from A to C in the graph shown might be caused by:
A) an increase in price.
B) a decrease in price.
C) an increase in income.
D) a decrease in income.
Correct Answer:
Verified
Q44: You just heard about Burton's annual tent
Q46: An expectation of increased prices of a
Q71: Ray's company just announced everyone will be
Q73: Roy just got a big promotion at
Q74: The price of dog collars,a normal good,has
Q75: There has been a decrease in the
Q78: Darren loves to go to the movies,and
Q79: This graph depicts the demand for a
Q80: The price of house paint,a normal good,has
Q81: A supply curve:
A)visually displays the supply schedule.
B)is
Unlock this Answer For Free Now!
View this answer and more for free by performing one of the following actions

Scan the QR code to install the App and get 2 free unlocks

Unlock quizzes for free by uploading documents