The graph below depicts the change in antibody concentration following an initial and a later pathogen exposure.
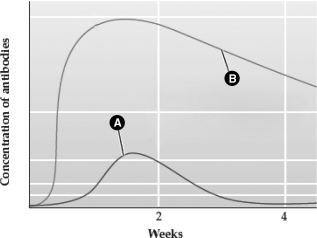
The line labeled with the letter ________ represents the response after the initial exposure.
Correct Answer:
Verified
Q70: The first exposure to a particular antigen
Q71: Vaccinations are required prior to traveling to
Q72: Despite its suitability as an infection site,the
Q73: HIV attacks B lymphocytes;this lowers the effectiveness
Q74: Because the first line of defense has
Q75: Some individuals may share one or more
Q76: The immune system can detect cancerous cells
Q77: In the case of AIDS,death is more
Q78: Macrophages,cells derived from a type of white
Q79: Individuals with HIV often experience infections that
Unlock this Answer For Free Now!
View this answer and more for free by performing one of the following actions

Scan the QR code to install the App and get 2 free unlocks

Unlock quizzes for free by uploading documents