Multiple Choice
Figure 5.1 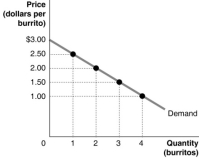 Figure 5.1 shows Arnold's demand curve for burritos.
-Refer to Figure 5.1.If the market price is $1.00, Arnold's consumer surplus is
A) $1.00
B) $2.00
C) $6.00
D) $7.00
Correct Answer:
Verified
Related Questions
Figure 5.1 Figure 5.1 shows Arnold's demand curve for burritos.
-Refer to Figure 5.1.If the market price is $1.00, Arnold's consumer surplus is
A) $1.00
B) $2.00
C) $6.00
D) $7.00
Correct Answer:
Verified

