Multiple Choice
Figure 5.1 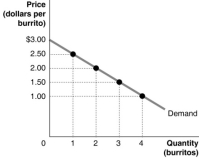 Figure 5.1 shows Arnold's demand curve for burritos.
-Refer to Figure 5.1.If the market price is $1.50, the consumer surplus on the first burrito is
A) $0.50
B) $1.00
C) $1.50
D) $7.50
Correct Answer:
Verified
Related Questions
Q29: What does a demand curve show?
A)The willingness
Q30: Table 5.3 Q31: Figure 5.1 Q32: Figure 5.1 Q33: Figure 5.1 Q35: Table 5.3 Q36: Table 5.3 Q37: What curve shows the marginal cost of Q38: Figure 5.1 Q39: Figure 5.1 Unlock this Answer For Free Now! View this answer and more for free by performing one of the following actions Scan the QR code to install the App and get 2 free unlocks Unlock quizzes for free by uploading documents![]()
![]()
![]()
![]()
![]()
![]()
![]()
![]()

