Exhibit 21-7 Use the cost-volume-profit graph below to answer the following question(s) .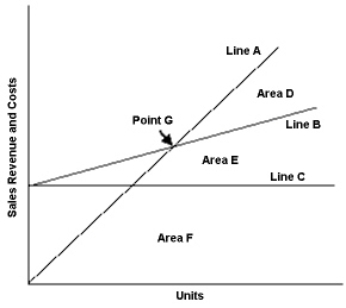
-Refer to Exhibit 21-7. Line C on the cost-volume-profit graph represents the:
A) Revenues
B) Total costs
C) Variable costs
D) Fixed costs
Correct Answer:
Verified
Q113: At a break-even point of 600 units
Q114: Collins Co. earned a profit of $2,000
Q115: If a company's total fixed costs decreased
Q116: Everclean Company cleans draperies. It charges $90
Q117: Stanley Company manufactures and sells one product
Q119: Exhibit 21-7 Use the cost-volume-profit graph below
Q120: After the break-even point is reached, a
Q121: Total contribution margin will increase in a
Q122: A graph that only plots profits and
Q123: Exhibit 21-8 Use the profit graph below
Unlock this Answer For Free Now!
View this answer and more for free by performing one of the following actions

Scan the QR code to install the App and get 2 free unlocks

Unlock quizzes for free by uploading documents