Exhibit 21-8 Use the profit graph below to answer the following question(s) .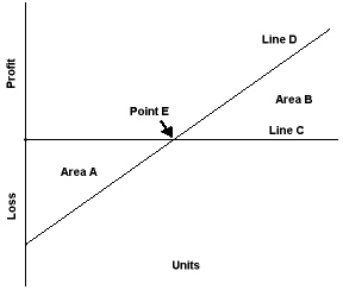
-Refer to Exhibit 21-8. Area B on the profit graph represents the:
A) Profit area
B) Total costs
C) Loss area
D) Break-even point
Correct Answer:
Verified
Q118: Exhibit 21-7 Use the cost-volume-profit graph below
Q119: Exhibit 21-7 Use the cost-volume-profit graph below
Q120: After the break-even point is reached, a
Q121: Total contribution margin will increase in a
Q122: A graph that only plots profits and
Q124: Block Company sells three products, each with
Q125: Jones Company sells two products, Gumbo and
Q126: To maximize its profits, a company should
Q127: Exhibit 21-8 Use the profit graph below
Q128: As compared to a company with a
Unlock this Answer For Free Now!
View this answer and more for free by performing one of the following actions

Scan the QR code to install the App and get 2 free unlocks

Unlock quizzes for free by uploading documents